Market Update - Is This Normal?
/From Your Gilbert & Cook Investment Team
Market fluctuations (volatility) come in many shapes, sizes, and timeframes. The origin of a stock falloff sometimes stares us right in the face such as the horrific terrorist attacks of September 11, 2001 or the Great Recession of 2008-2009. Other times the downturn is a detached concern when compared to negative movement in investor portfolios. In those cases, it matters most that the downturn is occurring, not necessarily what event is the catalyst.
Most trading days in October of 2018 fall into the latter category. There are a litany of issues drifting in and out of headline news. Mid-term elections, unemployment, interest rates, trade and tariffs, corporate earnings, etc, etc. Important sure, but not enough on their own merits to cause a meltdown. These issues and many others are the stuff of “normal” stock market volatility. Let us explain.
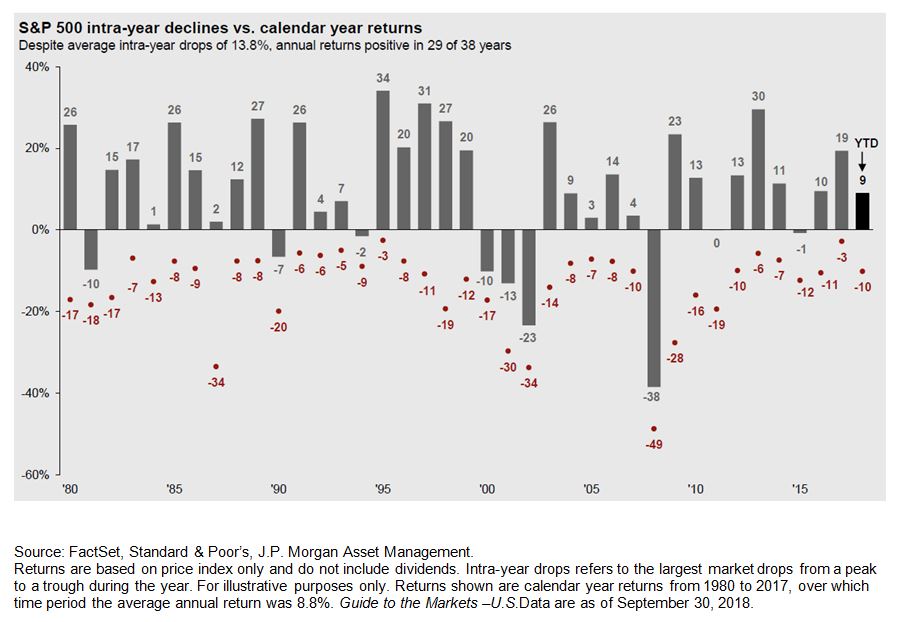
For the next few minutes, grant us that “normal” shall be defined by “how it usually works”. Usually, generally, typically, regularly, customarily, you get the picture. The chart below shows the price action of the S&P 500 index in each of the past 38 years. The gray bar shows the price change for the respective calendar year. The red dot illustrates the largest intra-year decline. So what is “normal” in this graphic? Well, usually, the market has gone up. 29 of the past 38 years or 76% of the time. 76% does not equal “always”, only typical. The red dot average is down -13.8%. So, a normal year still sees a pullback of nearly -14% at some point. Even if we eliminate the two worst years, the average downturn is -12.3%. Ups and Downs in stocks are normal.
Back to the year 2018. The S&P 500 saw a drop from January 26th to February 8th of -10.2%. Our worst stretch of the year, so far, and it happened in the timeframe of 9 business days. That February 8th low point marked the S&P 500 being down just -3.5% from the beginning of 2018. At its highest, the S&P 500 index level was up +9.6%. The Dow Jones Industrial Average follows a similar pattern up +8.5% YTD at peak and down -4.8% YTD at bottom. Through October 24th, both of these US Large Cap indices are hovering around flat for the year while bonds, small caps, and international stocks are all negative on the year. Pullbacks feel painful when happening, but don’t let emotions get the best of you. After some extraordinary years in 2012, ’13, ‘16 and ‘17, treading water in 2018 would appear quite possible.
The entire Gilbert & Cook team is here to help you navigate and discuss any topics you feel are key. We know it is imperative that you have access to your G&C Investment Team portfolio managers and to understand what is driving your investment performance.
Is this still normal? Yes.


