June means it's time for your Mid-Year Financial Checklist

What should you be looking at in June?

A mid-year financial check-in is a crucial practice for maintaining and improving one’s financial health. Typically this process is helpful during the month of June so that you can do a thorough review of your finances, including income, expenses, savings, and investments, to ensure you are on track with your annual financial goals.

By taking the time to assess your financial situation mid-year, you can make necessary adjustments, correct any deviations, and reinforce positive habits that will help you achieve your long-term financial objectives. This proactive approach allows for a more manageable and less stressful end-of-year financial review.

Mid-Year Checklist

Budget Review

·        Compare actual income and expenses against your budget.

·        Identify categories where you overspent or underspent.

·        Adjust budget allocations as needed for the remaining months.

Income Assessment

·        Verify all sources of income for accuracy.

·        Consider any changes in income, such as bonuses, raises, or additional income streams.

·        Plan for any expected changes in income for the rest of the year.

Expense Analysis

·        Review all regular and recurring expenses.

·        Identify any new or unexpected expenses that have occurred.

Debt Management

·        List all outstanding debts, including credit cards, loans, and mortgages.

·        Check balances, interest rates, and monthly payments.

·        Explore options for refinancing or consolidating high-interest debt.

·        Develop or update a repayment plan to stay on track.

Credit Health Check

·        Obtain a copy of your credit report from all three major bureaus (Equifax, Experian, TransUnion).

·        Check for any errors or signs of identity theft.

·        Confirm all open accounts are accurate and hard inquiries were approved.

·        Review your credit score and take steps to improve it if necessary.

  Savings Review

·        Evaluate the balance of your emergency fund.

·        Ensure you have at least three to six months of living expenses saved.

·        Review if cash on hand is in a high-yield checking or savings account.

·        Determine if cash in excess of the emergency fund should be invested.

·        Confirm you are taking advantage of employer funded savings such as an employer retirement plan match or HSA match.

·        Review savings goals for short-term and long-term objectives.

·        Adjust savings plan to meet these goals by year-end.

Investment Portfolio Review

·        Assess the performance of your investments.

·        Review asset allocation and rebalance your portfolio if necessary.

·        Check for any changes in risk tolerance or investment strategy.

·        Consider increasing contributions to retirement accounts if possible.

Insurance Coverage

·        Review all insurance policies (health, auto, home, life, umbrella, disability, etc.).

·        Ensure coverage is adequate and up-to-date.

·        Compare policies to find better rates or coverage if needed.

Tax Planning

·        Review the first half of the year's income and tax withholdings.

·        Estimate your tax liability for the year.

·        Make any necessary adjustments to withholdings or estimated tax payments.

·        If you need to make estimates, determine if estimates should be based on the prior year safe harbor or current year estimated liability.

·        Review for strategic opportunities to utilize Roth IRA contributions or conversions.

Financial Goals Update

·        Review your financial goals set at the beginning of the year.

·        Assess progress towards each goal.

·        Adjust timelines or strategies for achieving these goals if needed.

Financial Documentation

·        Organize financial documents and statements.

·        Ensure important documents are accessible and securely stored.

·        Consider going paperless if it helps with organization.

  Meet with your Advisor

·        Schedule a meeting with your Advisor

·        Discuss any major life changes that could affect your financial plan.

·     Seek guidance on any complex financial decisions or adjustments.

This holistic review ensures that your financial plans remain adaptable to any changes that may arise throughout the rest of the year. Reminder to keep an open line of communication with your Advisor for any changes in your financial situation.

March Madness Lessons

Going into March Madness and selecting your bracket, there’s a few things to think about.

We all need a “Coach”

Great coaches excel in providing leadership, instilling confidence, and leveraging their team members' strengths and natural talents. While players execute moves on the court, it's the coach who devises and implements strategies to guide the team effectively.

Maintaining adherence to a plan poses challenges, especially when players face pressure from fans and sports writers to deliver standout performances. Hence, one of the paramount qualities of a competent coach is the ability to foster a trust-based relationship. Without trust, even the most well-crafted plan risks being disregarded.

Similar principles apply to your financial plan. There are many key players such as your advisor, investment manager, and financial services associate. The finest among them work together to assist their clients in maintaining confidence in their goal attainment, even amidst short-term market fluctuations that may suggest otherwise.

Should you rely on guess-work?

The idea behind March Madness — and much of the fun — is predicting how the tournament will unfold and which team will emerge as the winner. You can analyze past performances, or study point differentials, first round win percentages, and any number of other metrics. Ultimately, it’s a guessing game. The same holds true for the market.

Investors employ everything from past pricing history to sophisticated software in their quest to choose the big market winners. Your advisor, however, knows the goal isn’t predicting the next maven. It’s building and managing an investment portfolio that can address your specific goals, for you to live your life of abundance.

Picking the NCAA tournament champion may win you bragging rights or a few bucks from the office pool. But a financial professional's personalized guidance and focus on your long-range financial plan is what can get you working towards a winning investment strategy.

Facts over feelings 
Emotion-driven decisions can shadow both March Madness and investment markets. When there are fluctuations within the markets, investors receive heightened emotional responses. The NCAA tournament's drama mirrors market fluctuations, with intense moments and unexpected outcomes capturing attention. While the thrill of March Madness fades after the championship, emotional investment decisions can have lasting financial consequences. Financial advisors offer relief from daily market stress, guiding investors away from impulsive choices that deviate from their plans.

In both bracket predictions and investing, facts must outweigh feelings. Wishful thinking can often cloud your decision-making, leading to undesirable outcomes. Whether picking a tournament winner based on alma mater pride or following the crowd in investment trends, emotions can affect your judgment. Guidance from your advisor offers a rational approach, utilizing research and expertise. Your advisor is there to help you navigate complex financial landscapes with your best interests in mind.

Individual investors who depend solely on themselves face the potential of succumbing to emotional pitfalls similar to those experienced in March Madness brackets. In contrast, your Gilbert & Cook team can prioritize factual analysis over impulsive decisions, dissuading from following herd mentalities or emotional biases. By adopting a disciplined, evidence-based strategy, investors can minimize risks and effectively pursue long-term financial objectives under the guidance of your advisor.

Everyone can relate to a come-back

Of course, we do love to see an underdog win. The problem with that is underdog successes aren’t that common in the later rounds of the NCAA tournament. Remember that when you pick those teams for your bracket.

The same can be said for investing. It may be fun to select the under-dog investments, but they generally involve an increased level of risk. Work with your Gilbert & Cook Advisor to assess your risk tolerance. Assess this each year to keep you dialed into your goals.

Your financial well-being is no game

Regardless of who you pick to “take it all” for March Madness, life returns to normal the following day —no matter the outcome of the tournament. That championship game is just that: a game. That’s not the case with your financial well-being, it’s your future.

You really can’t do much to increase the odds of a perfect March Madness bracket. You can improve your chances of achieving your financial goals by working with your advisor to put together a thought-out plan to help get you on the winning path, to live a life of abundance®.


Gilbert & Cook is an SEC registered investment adviser.  SEC registration does not constitute an endorsement of Gilbert & Cook by the SEC nor does it indicate that Gilbert & Cook has attained a particular level of skill or ability.  This material prepared by Gilbert & Cook is for informational purposes only.  It is not intended to serve as a substitute for personalized investment advice or as a recommendation or solicitation of any particular security, strategy or investment product.  Economies and markets fluctuate.  Actual economic or market events may turn out differently than anticipated.  Gilbert & Cook does not provide tax or legal advice, and nothing contained in these materials should be taken as tax or legal advice.  Past performance is no guarantee of future results.

2022 Mid-Year Update Event (Video)

“History doesn’t repeat… but it often rhymes”.

On June 30th 2022, Gilbert & Cook hosted a mid-year update event, featuring BlackRock economist, Mark Peterson.

This event is meant for informational purposes only. The featured speaker is not affiliated with Gilbert & Cook, Inc. Gilbert & Cook, Inc. does not offer tax or legal advice. You should consult with an attorney for legal advice and a qualified tax professional for tax advice. Gilbert & Cook, Inc. is a Registered Investment Adviser. Advisory services are only offered to clients or prospective clients where Gilbert & Cook, Inc. and its representatives are properly licensed or exempt from licensure. Past performance is no guarantee of future returns. Investing involves risk and possible loss of principal capital. No advice may be rendered by Gilbert & Cook, Inc. unless a client services agreement is in place.

2021 is Off to a Fast Start!

Economic Update - written January 25th 2021

Ready… Set… Go!

The stock market’s first hurdle of the New Year was to assess the runoff elections happening for the two Senate seats in Georgia. A special election such as this has only happened a handful of other times in our nation’s history, so the market appeared anxious about the process.

The market’s second hurdle was the electoral college count that would confirm Joe Biden as the 46th president of the United States. A protest during the vote count unnerved investors, and most of the New Year’s rally was undone. However, just one day later the market climbed higher as traders looked past the unrest.

Stocks Scale New Heights

Midway into the 1st month of the new year stocks rallied. Testimony from incoming Treasury Secretary Janet Yellen raised hopes for a new round of federal spending when she suggested to the Senate Finance Committee that lawmakers should “act big” on fiscal stimulus.

An orderly presidential transition and the anticipation of a more effective vaccine distribution plan contributed to stocks touching multiple new highs this month. Investor enthusiasm was further supported by a strong start to the fourth-quarter earnings season.

What does this fast-paced market activity mean for investors?

There will always be a lot of noise. But remember, making a change to your portfolio should be driven by sound analysis and preparation. Reacting impulsively to market volatility can compromise the return of your portfolio and your overall financial plan. As Advisors we have come to expect the volatility that comes along with investing and have anticipated these trends as we developed your overall financial strategy.

If you have any questions about your personal financial situation, please reach out to a member of your Gilbert & Cook Abundance Team.

Economic Update - 12/24/20

A rollout for a COVID-19 vaccine led to a positive reaction from the markets, and stimulus talks continue.

YEAR-END ECONOMIC STIMULUS BILL

On Monday, December 21st, congress passed legislation which offers a wide range of help, both for individuals and for struggling elements of the economy - including direct payments, enhanced unemployment benefits and tax breaks. Here are a few highlights of what’s inside the massive year-end compromise:

$166 billion in direct checks - Individuals making up to $75,000 a year will receive a payment of $600, while couples making up to $150,000 will receive $1,200, in addition to $600 per child.

$120 billion in extra unemployment help - Jobless workers will get an extra $300 per week in federal cash through March 14.

$325 billion small business boost - Pandemic-ravaged small businesses would see a total of $325 billion, including $284 billion in loans through the Paycheck Protection Program, $20 billion for businesses in low-income communities and $15 billion for struggling live venues, movie theaters and museums.

Tax Benefits - The legislation allows businesses to deduct expenses associated with their forgiven PPP loans, in addition to expanding the employee retention credit intended to prevent layoffs. The package rolls over a variety of temporary tax breaks known as “extenders” - some for multiple years. It also extends a payroll tax subsidy for employers offering workers paid sick leave and boosts the Earned Income Tax Credit.


WALL STREET

Stocks climbed higher amid the COVID-19 vaccine rollout and an improving outlook after a fiscal stimulus bill.

The Dow Jones Industrial Average, which has lagged all year, gained 0.44%. The Standard & Poor’s 500 picked up 1.25% while the Nasdaq Composite index surged 3.05%. The MSCI EAFE index, which tracks developed overseas stock markets, rose 2.44%. (1,2,3) 


STOCKS CLIMB HIGHER

In a week that celebrated the national rollout of a COVID-19 vaccine, market enthusiasm was tempered by worries of infection caseload and fresh economic lockdowns.

Investors turned their focus to the fiscal stimulus negotiations in Washington, D.C., with the hope that a relief bill may be the bridge that gets the economy over its near-term troubles until vaccine distribution grows more widespread.

These negotiations were not smooth sailing. When a compromise bill appeared to gather support, markets quickly moved higher, with the Dow Jones Industrial Average, S&P 500, and NASDAQ Composite all setting new record high closes on Thursday. (4) Stocks slipped in the final day of trading as stimulus hopes wavered. 


FED OUTLOOK ON THE ECONOMY IMPROVES

The Federal Reserve on Wednesday concluded its last meeting of the Federal Open Market Committee for 2020. Fed officials provided more detail for its monthly bond purchase program and reiterated their commitment to a monthly purchase of $120 billion of Treasury and mortgage-back securities until its inflation and employment goals are met. (5) 

The Federal Reserve also raised its outlook on the U.S. economy. It revised its September forecast of a 3.7% decline in GDP in 2020 to a 2.4% decline, and increased its 2021 GDP growth forecast from 4.0% to 4.2%. It also expects unemployment at 2020 year-end would fall to 6.7%, substantially lower than its earlier estimate of 7.6%. (6) 


CITATIONS:

1. The Wall Street Journal, December 18, 2020

2. The Wall Street Journal, December 18, 2020

3. The Wall Street Journal, December 18, 2020

4. CNBC, December 17, 2020

5. The Wall Street Journal, December 16, 2020

6. CNBC, December 16,2020

Confidence in a Crisis

Below is a summary of our recent webinar, "Confidence in a Crisis", originally aired on May 5th, 2020. The Gilbert & Cook team shares insight on the current economic state and explore some financial and investment opportunities. Even though we are in uncertain times, we believe that you still have choices and we believe in finding confidence in those opportunities. Please know that every situation is unique and we encourage you to speak with your Advisor regarding your individual situation. 


The Corona-virus Aid, Relief and Economic Security (CARES) Act

Recently the $2.2 trillion CARES Act was signed into law in hopes of helping those most impacted by the COVID-19 pandemic. This brings far-reaching implications for both families and businesses, as well as many opportunities and planning strategies to consider.

Increased Charitable Deductions:

As you might expect, charities are in great need. Charitable donations of cash up to $300 may be as an "above-the-line" deduction when determining your Adjusted Gross Income ("AGI") in 2020. The Act also provides for higher limits (in calendar year 2020) for cash contributions by taxpayers who itemize deductions.

Individual taxpayers will be allowed to deduct cash donations up to 100% of their 2020 AGI - that is up from the limit of 60% in previous (and subsequent) tax years. Corporate taxpayers will by allowed to deduct up to 25% of their taxable income in 2020 - up from 10% in previous years. One caveat here is that the increased limit does not apply to donations to private foundations or donor advised funds - AND to use the increased limits your contributions must be made in cash, directly to the charity.

Qualified Charitable Distributions

Another popular strategy that has often been considered is a Qualified Charitable Distribution ("QCD"). This year, however, you may need to rethink that strategy. Due to the unlimited charitable deduction allowed for cash gifts, IRA holders can utilize cash distributions from their IRAs and give the proceeds to their favorite charity. If you are itemizing deductions for income tax purposes, you can deduct this charitable distribution (subject to reductions in total itemized deduction based on your level of AGI). This may result in a much larger deduction available than in years past, (which was limited to $100,000 (QCDs from IRA accounts)). This may be the only year this strategy can be utilized. We encourage you to talk to your tax preparer and Advisor to determine what strategy is right for you.

 Retirement Plan Distributions

Those who have inherited either 401k or IRA accounts in the past will not be required to take distributions in 2020 under the CARES Act. Additionally, if you would have normally had a Required Minimum Distribution ("RMD") from a retirement account in 2020, those have also been suspended for 2020. RMDs are the distributions that you are required to take from your qualified retirement accounts and IRAs at age 72 (formerly age 70 1/2 prior to the SECURE Act passed at the end of 2019). Many people use these retirement plan distributions for their day-t0-day cashflow, while others have just had to deal with the required distributions as part of their annual personal tax planning. Again, every situation is different so please consult with a qualified tax professional if you have questions about your specific tax situation.

Prior to the CARES Act, if you were under the age of 59½, typically you paid a 10% penalty to take a withdrawal from a retirement account. In calendar year 2020, however, if you are under 59½ AND affected by COVID-19 (specific requirements in the Act must be met), those withdrawal penalties are waived for distributions up to $100,000 (or 100% of your account, if less). Keep in mind that you will still be required to pay income tax on the withdrawal amount, just the 10% early withdrawal penalty is waived. Note: There are also provisions that the withdrawals will not be taxed IF the amounts are returned to the retirement account(s) within specific time-frames. Again, consult with your tax advisor as it relates to your personal tax and financial picture. 


Timely Tax & Investment Strategies

Tax Loss Harvesting

You may have heard the saying, “when the market is down, you don’t lose any money until you sell the investment and recognize the loss.” So why would you want to sell at a loss?

We are NOT recommending that investors get out of the market. We always challenge investors to think about investment strategies that may be beneficial for their overall individual tax and financial situations.

Tax Loss Harvesting occurs when selling a security at a price less than you paid for it in order to use the recognized loss to offset other recognized gains and/or ordinary income for the current or future tax year. Harvested capital losses can be used to offset capital gains later in the year or possibly decrease your other taxable income (up to $3,000 per year). Any net capital losses (over the $3,000 annual maximum that can be used against ordinary income) can be carried forward to future years. It is important to 1) consider the financial plan you and your Advisor have put into place; 2) review your specific portfolio; and 3) see if there are some losses that it makes sense to harvest. Once again, we encourage you to talk with your Advisor and tax professional to see what is best for you.  

Roth IRA Conversions

What is a Roth Conversion? Basically, it is when you take money out of your traditional IRA and move it into a Roth IRA. In doing that, you are trading tax deferred dollars inside your traditional IRA for completely tax-free growth and tax-free withdrawals in the future in a Roth IRA. As the original account owner, you are not required to take RMDs from Roth IRAs, and the Roth IRA is a great legacy asset to leave for the next generation(s).

There are tax considerations to keep in mind, though. You DO have to pay income tax on the value of the assets that you convert from “traditional” to Roth. Although Roth IRA contributions do not provide immediate tax benefits like traditional IRAs, there is more flexibility in the future when it comes to withdrawing the funds and planning for taxes. This could be an opportune time to take advantage of this simple tax strategy (the Roth Conversion). Be sure, however, to consult with your tax advisor to determine your specific income tax implications.

Frontloading Contributions

If you are a long-term investor, there can be some good opportunities when the market is down. We have encouraged many of our clients to make their annual 401(k) or IRA contributions while the market is down (thereby providing an opportunity to buy into portfolios at a lower cost).


How to Keep Score During COVID-19

As we started into the economic understanding of this pandemic just two months ago, the world had three big, real-time scoreboard numbers that everyone was watching: 1) the number of new COVID-19 cases; 2) initial unemployment claims; and 3) the stock market. And ALL the numbers were bad! We are still getting constant doses of “Breaking News” and the latest stock market fluctuations. Since our March article, “What Turns a Healthcare Crisis into a Financial Crisis”, we’ve seen the following play out: forced shelter in place, forced business shutdowns, business revenue loss, job loss, economic contraction, debt and rent delinquencies, state and local governments strained, etc.

So, let’s call it what it is, the US is in the midst of a recession. We were due, after the longest run in history of uninterrupted economic expansion. Recessions, as a matter of course, are normal parts of the economic cycle. However, we couldn’t have predicted a recession due to a forced closure of vast parts of the economy due to a global pandemic. So how bad is this recession compared to others?

Gross Domestic Product (GCP)

In the 1st Quarter of 2020, it was reported that US goods and services were down -1.2%. That of course is -4.8% on an annualized basis – which is the reported number for the headlines. Estimates now for the 2nd quarter – April, May, June – are worse yet. Depending on how quickly the economy reopens, probably down somewhere between 20 – 30% on an annualized basis. That would mean that in the first two quarters of the year, the GDP would have contracted somewhere between 6-9%.

To put that into perspective, the entire 2008-2009 contraction was -4%. And it took six quarters to play out. The first half of 2020 will be a number that, most likely, far surpasses that. From a single quarter perspective, if we hit the 6-9% contraction level in the second quarter, we are basically retracing our steps to 2016 GDP levels. 

Bear Market Drawdown and Recovery

From the highpoint on February 19th, to down -34% on March 23rd took 23 trading days. Let’s look at how quickly, and compressed, that market recovered so far. On May 5th, we are up more than 28% from that bottom - a very compressed recovery time of only six weeks. So, what happened? The government has stepped in and provided various supports for our economy, including bond market backstops and the CARES Act as mentioned above.

The US Stock Market is a regenerating, rejuvenating mechanism. After a financial crisis, we find that opportunities emerge, and new ideas replace the old. The economic world is always evolving and adapting, and the stock market is the best way to participate in that. As investors, we have to be focused on the long-term nature of the market. If the recovery takes longer than expected, the markets will likely react negatively. We will need to be patient in terms of our expectations for stocks and GDP output. 

Resetting Expectations

As we look at our current economic situation, we must reset our future expectations upward. 2020 saw Gilbert & Cook start the year with relatively conservative stock and bond expectations. We were at historic highs in the stock market and historic lows in interest rates. We will admit, we did not anticipate a pandemic and recession in 2020. But given that, all stock categories and debt categories (except US Treasuries) now have better long-term expectations from where we sit today. In this pullback, we do hit a reset button to some degree. In periods of crisis and downside like this, it is not the correct time to stray from the long-term financial plan we have put into place.

Keeping Score

Initial jobless claims are a score-keeping mechanism for the economic downtown and recovery. Since the shutdown at the beginning of the COVID-19 crisis, in the last six weeks we’ve seen 30 million people file for initial unemployment claims at their state's unemployment office.

What we truly believe here is that those jobs are not gone – they are in hibernation. Out of isolation – when safe, those workers will return to their jobs and businesses will once again be back near full-capacity. Part of the government stimulus program increased weekly unemployment benefits. In most states, the additional stimulus makes the average replacement wage equal or greater than 100%. Therefore, the impact to individual households will be much more tolerable than in previous economic crises. We are more focused at this time on the number of continuing unemployment claims. In just the last 2 weeks, we saw more workers going back to work than the number of new claims filed.

Risks

The sole villain in this drama is the Coronavirus itself. If you eliminate that enemy, you see the markets react very positively. The risks are:

  • A virus relapse causing the economic resuscitation taking longer than anticipated. How much uncertainty will people tolerate? As we go back to work, are we willing to trade possible loss of life? Will the country go back to work, or will there be a fear of further contamination? A recovery is dependent on bringing jobs and consumers back out of hibernation and reinvigorate the economy as quickly and as safely as possible.

  • Dividend Payouts – Certain providers in energy, retail, and real estate sectors are cutting their dividend payouts. 

Opportunities

Know yourself as an investor. The stock market will reinvent and regenerate itself. Lean into your Gilbert & Cook team to help you know your course and follow your plan.

We believe that American ingenuity and resilience will persevere. The world health and science communities are smarter and better funded than at any time in history. Ever.

We believe the debate is around when the virus will end, not if. And that COVID-19 is the only enemy. If the virus is contained then all those other issues that we are talking about will begin to dissipate.

We believe that life after the virus will be different. In the same way that 9/11 changed our way of life forever, this pandemic may also. But we will figure it out. And every day, all across the world - people get up, they go to work, and they make the lives of their families and communities better. 

Be safe & healthy. Please reach out to your Gilbert & Cook family if there is anything that you need.


Disclosure: This event is for informational purposes only. Gilbert & Cook, Inc. does not offer tax or legal advice. You should consult with an attorney for legal advice and a qualified tax professional for tax advice. Gilbert & Cook, Inc. is a Registered Investment Adviser. Advisory services are only offered to clients or prospective clients where Gilbert & Cook, Inc. and its representatives are properly licensed or exempt from licensure. Past performance is no guarantee of future returns. Investing involves risk and possible loss of principal capital. No advice may be rendered by Gilbert & Cook, Inc. unless a client service agreement is in place.

Market Insight - March 2020

Brandon Grimm, MBA, CFA

Brandon Grimm, MBA, CFA

Brandon Grimm, Portfolio Manager at Gilbert & Cook provides insights on recession concerns, recent market volatility, and the importance of re-balancing.

There has been much discussion and debate over where we are in this economic cycle. From our perspective, we remain in the latter stages but believe the modest-growth/modest-inflation/low-interest rate environment we have been living with has a good chance of continuing over the course of at least this year. While the probability of a recession occurring at some point in 2020 is not zero, we do believe it is low. However, as I will discuss later, the chances of a recession do appear to be growing as the coronavirus spreads globally and begins to impact global supply chains and consumer confidence. 

Despite those fears, the Gilbert & Cook Investment Team still maintains a positive view on the U.S. economy, as current fundamentals still support a prolonged recovery where unemployment remains low, job growth and wages increase, borrowing costs remain low, and most importantly we see a healthy and confident consumer base. 

We compare this recovery to running a marathon and reiterate our view for investors to remain fully invested according to their diversified, long-term Strategic Asset Allocation. 

Coming off an extraordinary 2019, the stock market continued its upwards trajectory with the S&P 500 Index closing at a record high of 3,386.15 on Thursday, February 19th (up +4.81% YTD). Then last week fear over the Coronavirus (COVID-19) finally gripped investors as both the Dow Jones Industrial Average and the S&P 500 index fell over 3% multiple days and ended the week down 12.26% and 11.44% respectively. The daily declines were the largest daily declines in two years and the weekly return was the worst since 2008. With minimal volatility over the past six months, one could argue at least a minor pullback was overdue irrespective of the catalysts. 

As we look at the next few quarters, the real economic impact of the coronavirus will need some time before it is fully understood. In the meantime, fear appears to be driving the markets to price in a major economic impact and even a potential recession. Although we are not comfortable going there yet, we recognize the longer the virus disrupts trade and supply chains, the greater the chance the markets remain at correction territory levels and a subsequent economic recession.

Maybe this time is different….or is it?  We look to history for the answers and similar recent events for context. Over a 38-day trading period during the height of the SARS virus back in 2003, the S&P 500 index fell by 12.8%. During the Zika virus, which occurred at the end of 2015 and into 2016 the market fell by 12.9%.1  As we have pointed out during prior times of stress, the S&P 500 Index has never failed to fully recoup any losses sustained from corrections or bear markets over time. In other words, the stock market and more broadly speaking, the U.S. economy, has proven itself to be quite resilient. Last week’s rather quickly pullback was likely overdone as evidenced by the strong market rebounds on Monday, with various stock indices gaining over 5% on the day. For more perspective on pullbacks and market volatility, reference our Timely Topic from October 25th, 2018 entitled Market Update – “Is this still normal?”.

This does not mean investors should dismiss the outbreak altogether, but rather use these pullbacks as:

1) a time to ensure cash needs are supported, or

2) buying opportunities to re-establish or add to equity exposure if your risk tolerance allows.

Certainly, risks remain, and the duration of the outbreak will determine the near-term impact to the global economy. Revenues and earnings from companies that are highly exposed to China will unquestionably be affected. The longer the virus remains, specifically in China, the greater risk to the global supply chain and ultimately the soundness of economic fundamentals.

In the end, we believe the U.S. is relatively insulated given a strong economy and fantastic health system. Robust job growth and more fiscally responsible consumers continue to provide solid underpinnings in the U.S. Economic data has been strong to start the year and so far, nothing has changed. We suspect that any drop in earnings or economic activity will be short lived, and more than made up for in the year to come.  

Right now is not the time to overreact. Instead, Gilbert & Cook has been proactive in protecting portfolios from events and pullbacks like these during this recovery by regularly re-balancing portfolios. Through the planning process we established a Strategic Asset Allocation which is all about balancing risk and reward given your time horizon and other factors. Regular portfolio re-balancing is a disciplined process to help reduce downside investment risk and ensures that your investments are allocated in line with your financial plan. We continue to focus on investing for the long run and potential short-term disruptions can give investors long-term opportunities.

As we’ve said before; Rely on process, not prediction. The Gilbert & Cook team keeps focus on patience and a long-term perspective.


Sources: 1First Trust Advisors L.P.

2019 Market Review & 2020 Outlook

By: CHRIS COOK, CPA, CFA
Partner, Chief Investment Strategist

Market Update : 2019 Year in Review

Trade wars and a decline in global manufacturing weighed heavily on the overall state of the economy this past year. However, resilient consumers and a cut to interest rates provided a positive counterbalance for the stock market, which reached record highs in 2019.

What drove the 2019 markets? Three key factors had the most influence over investment performance in 2019:

The Fed did a major pivot in U.S. monetary policy in 2019.

In 2019 the central bank made three quarter-point cuts to the benchmark short-term interest rate. Investors welcomed this change, counter to the interest rate hikes in 2018. Since January, when the Fed began changing course, the S&P 500 index has risen more than 600 points, or 25 percent and the unemployment rate fallen from 4 percent to 3.5 percent - putting the economy on solid footing heading into 2020.

 (washingtonpost.com/business/2019/12/11/year-federal-reserve-admitted-it-was-wrong/ [12/11/19])

The trade quarrel with China cooled down slightly.

In December, representatives from both nations agreed on a “phase-one” trade deal after a year-and-a-half of imposing tariffs on each other’s products. The new agreement, which is expected to be signed in early 2020, will be the initial step toward a larger deal in hopes to reduce some US tariffs in exchange for more Chinese purchases of American products and better protection of US intellectual property. bbc.com/news/business-45899310 [12/16/19]

Earnings beat (low) expectations. 

One year ago, stock market analysts were pessimistic about corporate profits. With economies worldwide slowing down in 2018, year-over-year earnings growth for S&P 500 firms seemed ready for a slowdown as well.

Deceleration was evident, but as the year passed, many firms managed to exceed reduced estimates. According to stock market analytics firm FactSet, 75% of S&P 500 components beat earnings-per-share estimates in Q3, compared to a 5-year historical average of 72%. (insight.factset.com/earnings-insight-q319-by-the-numbers-infographic [11/21/19])

The S&P 500 climbed above 3,000 for the first time finishing 2019 up 31.49%. The Dow Jones Industrial Average advanced 25.34%, while the Nasdaq Composite was up 36.69%. (Morningstar)

Certainly an impressive year by any measure, but let’s look longer term. Specifically, at the last two decades. The 2000’s were much tougher for the S&P 500. For the 10-year period 2000-2009, the index was down a cumulative -9.1% (-0.95% per year). The next decade, capped by a notable ‘19, was up by +256% (annualized +13.65%). The average for the entire 20 years? +6.06%.

An innocuous prediction for the next 10 years would be somewhere between those two decades of extreme.

Looking Ahead to 2020

The news and political cycle will remain volatile this year. A U.S. economic outlook split between manufacturing and business investment still struggling to decipher trade deal(s), however, interest rates and borrowing costs are likely to remain unchanged for some time and consumer confidence and spending is expected to stay healthy and strong with low unemployment.

As we’ve said before; Rely on process, not prediction. The Gilbert & Cook team keeps focus on patience and a long-term perspective. Living an abundant life and fulfilling the needs of your future is dependent on the plans and solid process executed today.

Mergers & Acquisitions - 2019 Mid-Year Market Outlook

Excerpts from Gilbert & Cook's "Mid-Year Outlook - Plans, Priorities & Expectations in the Public & Private Marketplace" By Steve Jacobs

What is the status of the U.S. M&A market and what is the future outlook?

  1. Competitive environment and it is definitely a seller’s market, but buyers are doing more strenuous due diligence to make sure of what they acquire.

  2. Prices and multiples are high for quality companies due to lack of quality businesses on the market.

  3. PEGS and large corporates are willing to look at smaller transactions, actually making venture and angel investments to bolster R&D and technology.

  4. Cross border deals are down 50% from last year.

  5. Key reasons are unresolved issues like Brexit and trade policies.

  6. U.S. economy has been surprisingly resilient as we are experiencing our longest ever economic expansion of 11 years (but global growth has slowed).

  7. FACTSET U.S. MergerMetrics for trailing twelve months: 13,569 deals closed, up over 7% year over year.

What is impacting valuations in today’s market?

  1. Low interest rates.

  2. Banks hungry for earning assets (loans) – funding up to 50% or more of transaction value.

  3. Plenty of equity capital.

  4. Lack of quality companies on the market for sale.

  5. Strong buyer demand for growth via acquisition.

  6. According to Warren Buffet’s letter to shareholders the last 3 years, he shared, “Given the army of optimistic purchasers, price seems almost irrelevant.”

Read the full article from Steve Jacobs and BCC Advisors.

Trade Tensions - 2019 Mid-Year Market Outlook

On July 18th 2019, Gilbert & Cook hosted a Mid-Year Market Outlook luncheon and panel discussion.

TRADE TENSIONS

(Moderator, Brandon Grimm)
Obviously there’s a lot of news right now about trade tension. So let’s put that into perspective from each of your respective markets. How is trade impacting your markets and what are some other disruptors that we might see?

(Response by: Dr. Keri Jacobs - Economist, ISU Extension)

As far as tariffs being put on goods, retaliation from china and then our subsequent retaliation. The biggest sectors for Iowa that are feeling the impact are soybean production and pork production.

There are short term consequences, outlined in the recent report released by the Center for Agricultural and Rural Development: CARD Report. This report states that overall losses in Iowa’s Gross State Product are calculated to be $1 to $2 billion. Short term losses are about 10% of the pork and soybean industries respectively.

Longer term, as this trade war continues and as other countries stop taking our goods, what happens is that the countries who can’t produce goods at the low cost that we can, now they have an opportunity to step into the market. The biggest challenge that we could face is some of those markets going away from the US. The longer term challenge is not the acute loss of trade, it’s the larger risk of losing our place in the trade market. If we are no longer the lowest cost producer and if we’re out of the game for some time, we could lose our seat at the table.

(Response by: Steve Jacobs - President, BCC Advisers)

From an M&A  perspective, supply chain disruption can be a key factor. Increase cost of sourcing good and shipping goods, make it very difficult for distributors and manufacturers to be competitive.

The US and China relations on trade seem to have taken another step backwards. But as long as businesses in this country remain profitable and we keep inflation under control, there should be no reason for the market to step back or near a recession.

(Response by: Chris Cook - Chief Financial Strategist, Gilbert & Cook)

If you remember for last year’s event, 1-year ago we were talking about trade in the headlines. Since our discussion last year, we’ve improved our relations with trade partners, Canada, Germany and Mexico, however hog and soybean producers continue to get a disproportionate backlash from the tensions with China.

I think back on a quote from Mike Pyle, and I’ll use his words, “China never intended to ‘Play Fair’ …. Their intention was to take the worlds technology, copy it and make their economy around it”. Is it worth the fight? In my opinion it probably is. Because if we can’t get paid for the technology that we develop in the United States, by the rest of the world, then we will slowly fade. That’s where I come back and say, “Is it worth fighting? Yes”. People that we know in Iowa, people that we share a state with are bearing the brunt of it and hopefully we make it through. On a big picture, it is a very small percentage of our Net GDP is being impacted dollar wise by the tariffs so far. It’s a net effect, a fraction of our GDP in our global economy. At this point we see no clear end, and we should expect it to continue to invoke volatility.


Market Update - Is This Normal?

From Your Gilbert & Cook Investment Team

Market fluctuations (volatility) come in many shapes, sizes, and timeframes.  The origin of a stock falloff sometimes stares us right in the face such as the horrific terrorist attacks of September 11, 2001 or the Great Recession of 2008-2009.  Other times the downturn is a detached concern when compared to negative movement in investor portfolios.  In those cases, it matters most that the downturn is occurring, not necessarily what event is the catalyst.

Most trading days in October of 2018 fall into the latter category.  There are a litany of issues drifting in and out of headline news.  Mid-term elections, unemployment, interest rates, trade and tariffs, corporate earnings, etc, etc.  Important sure, but not enough on their own merits to cause a meltdown.  These issues and many others are the stuff of “normal” stock market volatility.  Let us explain.

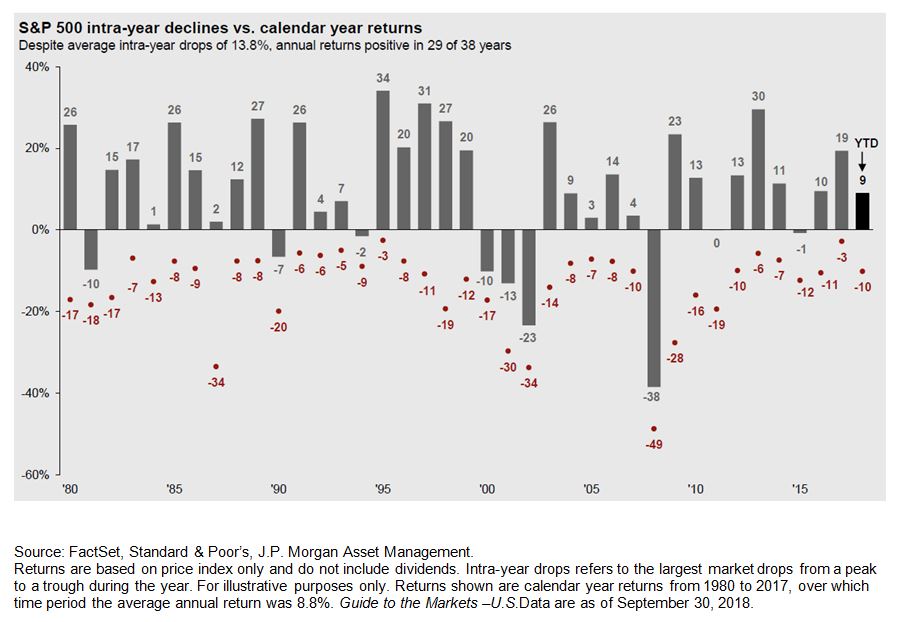
For the next few minutes, grant us that “normal” shall be defined by “how it usually works”.  Usually, generally, typically, regularly, customarily, you get the picture.  The chart below shows the price action of the S&P 500 index in each of the past 38 years.  The gray bar shows the price change for the respective calendar year.  The red dot illustrates the largest intra-year decline.  So what is “normal” in this graphic?  Well, usually, the market has gone up.  29 of the past 38 years or 76% of the time.  76% does not equal “always”, only typical.  The red dot average is down -13.8%.  So, a normal year still sees a pullback of nearly -14% at some point.  Even if we eliminate the two worst years, the average downturn is -12.3%. Ups and Downs in stocks are normal.  

Chart Oct 25.JPG

Back to the year 2018.  The S&P 500 saw a drop from January 26th to February 8th of -10.2%.  Our worst stretch of the year, so far, and it happened in the timeframe of 9 business days.  That February 8th low point marked the S&P 500 being down just -3.5% from the beginning of 2018.  At its highest, the S&P 500 index level was up +9.6%.  The Dow Jones Industrial Average follows a similar pattern up +8.5% YTD at peak and down -4.8% YTD at bottom.  Through October 24th, both of these US Large Cap indices are hovering around flat for the year while bonds, small caps, and international stocks are all negative on the year.  Pullbacks feel painful when happening, but don’t let emotions get the best of you.  After some extraordinary years in 2012, ’13, ‘16 and ‘17, treading water in 2018 would appear quite possible.

The entire Gilbert & Cook team is here to help you navigate and discuss any topics you feel are key.  We know it is imperative that you have access to your G&C Investment Team portfolio managers and to understand what is driving your investment performance.

Is this still normal?  Yes.

Mid-Year Economic Outlook

Mid-Year 2018 : Economic Update

THE MONTH IN BRIEF

U.S. stocks have been trending higher, but have endured some rough water over the past few weeks. In May, investors were left to interpret mixed signals. The historic U.S.-North Korea summit was on, then off, then on again. An apparent truce emerged in the U.S.-China tariffs battle, but it did not last. Oil rallied, but then prices fell. Federal Reserve policy meeting minutes indicated central bank officials would accept above-target inflation for a while. Other economic signals were clear: new and existing home sales were down, consumer confidence was back up, and consumer spending was strong. In the end, the markets took all this in stride – the S&P 500 rose 2.16% for the month.

Now in June, U.S. stocks continue to fall as a threat of new tariffs on Chinese imports from the U.S. is ramping up global trade fears. Treasury yields are dropping and the U.S. dollar is rising.

HOUSING

Mortgage rates may have soared in April, but they stabilized in May. On May 31, Freddie Mac’s Primary Mortgage Market Survey found the mean interest rate for a conventional home loan at 4.56%, which was 0.02% lower than on April 26. (At the end of May 2017, the average interest rate on a 30-year ARM was 3.95%.) 

Home buying fell off in April. According to National Association of Realtors research, there was a 2.5% retreat in the pace of existing home sales. Construction for single and multi-family units were solidly higher compared to the prior month and are up noticeably year over year. Building permits, one of the leading indicators tracked by the Conference Board as it is a gauge of future construction, fell in May compared to April. Permits for single and multi-family unit structures both declined month over month but both remain higher year over year.

LOOKING BACK…LOOKING FORWARD

The economy is still in good shape, and is likely to withstand possible storms ahead. Volatility is unlikely to diminish Fed tightening expectations for the rest of 2018. The Fed hiked rates 0.25% on June 13th.

Trade concerns continue to rise. Tariffs are now being levied on imported steel and aluminum, and the trading partners affected by these taxes are responding or planning to respond with tariffs of their own on U.S. goods. Could stocks stall out because of this? An impeded flow of international trade would certainly impact the GDP of the world’s major economies and exert a drag on corporate earnings. The uneasiness about the brewing trade war gives some investors pause; the potential scope of it seems too large to price in. It is hard to imagine any kind of summer rally if the measures and countermeasures taken by various countries escalate. Not all investors appear to be worried, though – witness what happened in May even as the distinct possibility of trade wars emerged. The blue chips were hurt, but the tech sector and the small caps held up. Do these shares have further room to advance, and will investors retain their bullishness about them? June presents significant questions for investors worldwide, and we may see equities take a pause as threatened tariffs become reality.

That being said, patience and endurance are important in the face of occasional ominous headlines as we look forward to long-term goals.

2018 Economic Outlook

2017 turned out to be a very attractive year in financial markets around the world.  Stocks were the story, but even bonds (Barclays US Aggregate index) were up +3.54%.  US large companies (as represented by the S&P 500 index) rose +21.83%, US small companies (Russell 2000 index) posted +14.65%, and international stocks (MSCI EAFE index) won the year at +25.03%.  The first year in 5, by the way, where Europe Australia and the Far East developed markets (EAFE) performed better than the S&P 500, and only the 2nd year in the past 8.  The S&P 500 had a positive total return (price + dividends) each and every month during 2017.  Remarkable.

So where from here?  What does 2018 hold for investors?  We’re side-stepping the direct question a bit as we paint a broader perspective.  Whether we credit Nostradamus, Mark Twain, or Yankee catcher/philosopher Yogi Berra, it is true; “It is difficult to make predictions, particularly about the future”. Certainly, that humorous quip does not keep mortal men from offering our honest and educated guesses about future events.  (Think politicians, economists and meteorologists).  But let’s have some candid reflection about our collective ability to do so.

Who would have predicted nine years ago that we would stand on top of mounting records in US equity markets?  That interest rates would still be near historic lows?  Or that Amazon’s market capitalization would easily eclipse that of Wal-Mart, Target, Kroger, Best Buy, Kohls, Macy’s, Dicks Sporting Goods, Under Armour, Dollar General, TJ Maxx, (plus others) combined?  A family can’t live in a virtual single-family home, but they certainly can shop for goods that way.  FYI…Target on its own made more profit over the past year than Amazon.

That nine-year reference is an important one.  2008 saw the S&P 500 drop by -37%.  The world was in the vice grip of financial system paralysis, and predictions of economic prosperity, lets be honest, were as scarce as home equity.  We all remember it.  How it felt.  Not to read about it from a 1929 history book, but to run our lives through it.  To make a forecast on January 1st, 2009, that the S&P 500 would increase on average more than 15% per year for the next nine would have come with a side of pixie dust.  Incidentally, the market would have been down nearly -25% to start that bold prognostication before ultimately coming true.

Backtrack even further to 1968.  The brightest minds from multiple disciplines were assembled in New York for the Foreign Policy Association’s fiftieth anniversary.  Within the throws of the Vietnam War and the cloud of Martin Luther King’s assassination, their charter was to look fifty years into the future, documented in a book called “Toward the Year 2018”.  Clear misses such as nuclear replacing natural gas and “the suppression of lightning” can be coupled with eerie accuracies like “large-scale climate modification will be effected inadvertently” from carbon dioxide.  Or, “a global communication system (of weather and communication satellites) would permit the use of giant computer complexes” with the revolutionary potential of a data bank that “could be queried at any time”.  Spooky.  So is “putting broad-band communications, picture telephones, and instant computerized retrieval in the hands of (humans)…is much too optimistic” to assume that these same technologies would entail the ability to use them wisely.
The biggest misses, however, were outlined recently by Paul Collins of The New Yorker in the current, real-life 2018.  “Not a single writer predicts the end of the Soviet Union – who in their right mind would have.  There’s also nary a woman contributor, nor a chapter on civil rights in sight.”  The 1968 book did ask the question: “Will our children in 2018 still be wrestling with racial problems, economic depressions, other Vietnams?” and then forgets to answer.

Today we sit in the comfort of hindsight.  Basking in the profits and prophesy.  But what did we really learn?  We learned that a forecast, if overtly relied upon, can miss the eventual truth considerably. A solid process, on the other hand, captures the “when”, not the “if”.  Process waits for the future patiently and
does not attempt precise calculation.

The Gilbert & Cook investment process shapes to each circumstance.  Future client events are planned for now and a diverse mix of tools are set in place to anticipate multiple forecasts. Near-term, mid-term, and long-term categories are matched to the risks and rewards fashioned together by our team and the client.  We spend our predictive power and experience on those issues that can be controlled.

We do still have thoughts around the obstinate big picture as the US economy has every chance to continue growing the next few years, thereby setting the record for the longest uninterrupted (by a recession) expansion in our nation’s history.  While stretched in terms of time, the dollars produced in this recovery trail past accounts so our view is toward sustainable growth.  New US corporate tax laws are favorable to company profitability and free cash flow providing a 2018 tailwind for stocks.  International equities may continue to outperform the US due to being earlier in their economic recovery cycle and more favorable in valuation and currency effect.  And our expectations for bond returns are muted, but continue to provide inevitable volatility control for stocks.

That’s the beauty, excitement, and reward of it; that no one can truly know in absolutes what lies around the corner.  Rely on process, not prediction.
 

Quarterly Economic Update - A Review of Q2 2017

THE QUARTER IN BRIEF

After a remarkable first quarter, the stock market cooled off slightly in Q2 – but investors still saw substantial gains. Strong earnings helped take Wall Street’s collective mind off a decidedly mixed bag of economic signals. Consumers remained confident as the quarter unfolded; although hiring, inflation, and consumer spending weakened. Home sales declined, then rebounded. Overseas, factory activity in China and the eurozone showed improvement, and foreign equity benchmarks continued climbing. Many commodities took sizable Q2 losses. When the quarter ended, the bulls were still firmly in charge.   (1)


DOMESTIC ECONOMIC HEALTH

As one quarter ends, the Bureau of Economic Analysis commonly makes its third and last assessment of the prior quarter’s economic growth (though, even this “final” estimate may be adjusted in later years). In the last week of June, the BEA announced a “final” Q1 growth number of 1.4%, which was nothing to celebrate. Would Q2 growth come in above 2%?   (2)

Second-quarter consumer spending data from the Department of Commerce raised some concerns about reaching that percentage of growth. While April and May brought solid growth for personal incomes (0.3% in the former month and 0.4% in the latter), the gain in personal spending fell from 0.4%, in the fourth month of the year, to 0.1%, in the fifth. Retail sales, too, tailed off: after rising a robust 0.4% in April, they fell 0.3% for May.    (2)

Households did feel good about the state of the economy and their financial prospects. At final readings of 97.0 in April, 97.1 in May, and 95.1 in June, the University of Michigan’s consumer sentiment index stayed well north of its 86.1 historical average. The Conference Board’s index ended the quarter at a very high mark of 118.9.    (2,3)

Hiring figures from the Department of Labor were somewhat weak. Monthly employment reports showed that U.S. firms added 174,000 net new jobs in April and 138,000 net new jobs in May. (In March, the number had been just 50,000.) Was the job market simply at capacity? Only time would tell. Reductions in the labor force participation rate helped send both the headline jobless rate and the U-6 rate, factoring in the underemployed, to notable lows. By June, the headline (U-3) rate had dipped to 4.3%, a level unseen in 16 years; the U-6 rate had fallen to a 10-year low of 8.4%.   (4)

On the manufacturing front, the news appeared better. The Institute for Supply Management’s factory purchasing manager index rose to 57.8 in June, a 34-month peak. This was after readings of 54.8 in April and 54.9 in May. ISM’s service sector PMI was also well above the expansion line of 50 in April and May, displaying respective readings of 57.5 and 56.9 in those months.   (5,6)

Still, federal government reports showed manufacturing and industry production falling off in Q2. Industrial output jumped 1.1% in April; then, flattened in May. Manufacturing output went from a 1.1% gain to a 0.4% retreat. Hard goods orders were down 0.9% in April; then, down 1.1% a month later.   (2)

Annualized inflation declined during the quarter. The May Consumer Price Index showed only a 12-month gain of 1.9% and just 1.7% for core prices. A month earlier, yearly inflation had been at 2.2% with the core CPI rising 1.9%. Did wholesale inflation also lessen? The headline number did, ticking down 0.1% in May to 2.4%. The core Producer Price Index was up 2.1% year-over-year through May, a 0.2% increase from April.   (2)

The Federal Reserve lifted the federal funds rate by another quarter point in June to a target range of 1.00-1.25%. It also disclosed it would begin reducing its massive bond portfolio “this year,” which could put pressure on long-term interest rates. The central bank intends to let $6 billion of Treasuries and $4 billion per month in agency debt and mortgage-linked securities mature per month to start. In late June, all 34 of the country’s largest banks passed the Fed’s annual stress tests – a milestone unseen since their adoption seven years ago.   (7,8)


GLOBAL ECONOMIC HEALTH

Emmanuel Macron’s decisive victory in France’s national election cheered investors concerned about the potential for another crack in the European Union, and it started a rally in the euro, which continued in June after European Central Bank President Mario Draghi commented that “the threat of deflation is gone and reflationary forces are at play.” Investors took those words as a strong hint that the ECB would presently end its quantitative easing. As the quarter concluded, Chancellor Angela Merkel’s reelection seemed probable in Germany; a fourth Merkel term would be another boost to EU economic confidence and stability.   (1,9)

Manufacturing economies accelerated around the world in the quarter. The Markit eurozone factory PMI reached 57.0 in May, and then, 57.4 in June (a 4-year peak). Manufacturing PMIs in Vietnam, India, South Korea, Taiwan, and Japan were all above 50 (the level signifying sector expansion) as Q2 wrapped up. China’s official factory PMI was at 51.2 in May; then, 51.7 in June. Its official service sector PMI came in at 54.5 in May and 54.9 in June.   (10,11)


WORLD MARKETS

One factoid conveys how well global equity benchmarks did in 2017’s first half: 26 of the world’s 30 major indices posted 6-month gains. The last time that happened was in 2009 – and it has only occurred in four other similar intervals within the past two decades.   (12)

Germany’s DAX finished the first half up an impressive 7.4% YTD, and France’s CAC 40 was up 5.3% on the year when Q2 ended. The United Kingdom’s FTSE 100 was 2.4% higher YTD on June 30. India’s Sensex topped the 31,000 level in June, reaching an all-time peak and outdistancing nearly all of its nearby Asia-Pacific benchmarks with an astounding 16.1% first-half advance. The Nikkei Asia300 index did even better, ending the first half of 2017 up more than 21% YTD.   (13,14)

Looking at some regional indexes, the pan-Europe Stoxx 600 index fell 0.5% in Q2, but still had risen 5.0% YTD through June. The MSCI World Index advanced 3.4% in the quarter, to go up 9.4% for the year; MSCI’s Emerging Markets benchmark rose 5.5% in Q2, taking its YTD gain to an impressive 17.22%.   (13,15)


COMMODITIES MARKETS

Oil traded under $50 for most of the second quarter, touching a low of $42.05 before rising to finish Q2 at $46.33 on the NYMEX. Gold ended June at $1,241.40; silver, at $16.57.   (1,16)

Losers outnumbered winners in the commodity sector in Q2, and some commodities took steep falls. Iron ore slid 21.37% in the quarter; sugar, 17.60%; gasoline, 11.16%; coffee, 10.95%. Other notable losses came for silver, oil, and cocoa, which were all down between 9-10% for the quarter; heating oil and natural gas gave back roughly 5%. Among the big Q2 winners: oats, up 29.32%; CBOT wheat, up 19.81%; feeder cattle, up 10.43%. Palladium picked up 4.78%; soybean oil; 3.62%; corn; 1.72%; copper, 1.66%.  (1)

The animal protein and grain sectors were the best-performing portions of the commodities market in the quarter, respectively gaining 15.13% and 13.34%. The energy sector fell 7.61%; the precious metals sector, 2.09%; the base metals sector, 1.75%.   (1)


REAL ESTATE

Home buying slumped in April and then rebounded during May. In the fourth month of the year, the National Association of Realtors calculated a 2.5% decline in resales – but a 1.1% May gain left them 2.7% improved over the past 12 months. That May gain happened with inventory down 8.4% year-over-year and a median existing home price 5.8% higher ($252,800) than a year before. The Census Bureau said that new home sales dropped 7.9% in April, but they rose 2.9% a month later.   (2,17)

Cheap mortgages were certainly a plus. In Freddie Mac’s March 30 Primary Mortgage Market Survey, mortgage types bore the following average interest rates: 30-year fixed, 4.14%; 15-year fixed, 3.39%; 5/1-year adjustable, 3.18%. Freddie’s June 29 survey showed the following averages: 30-year fixed, 3.88%; 15-year fixed, 3.17%; 5/1-year adjustable, 3.17%.  (18)

Three other closely-watched housing market indicators weakened in Q2. The Census Bureau’s monthly snapshot of housing starts and building permits showed starts down 2.8% in April and 5.5% in May as well as permits slipping 2.5% for April and 4.9% for May. The year-over-year advance on the 20-city composite S&P/Case-Shiller home price index was 5.9% in the March edition and 5.7% in the April edition (this is a famously lagging indicator). Finally, NAR’s pending home sales index took two small steps back, retreating 1.7% in April and 0.8% in May.  (2)


LOOKING BACK…LOOKING FORWARD

A sustained rally with only brief, minor setbacks left the notable U.S. equity and volatility indices at the following levels at the end of Q2: S&P 500, 2,423.41; Dow Jones Industrial Average, 21,349.63; Russell 2000, 1,415.36; Nasdaq Composite, 6,140.42; CBOE VIX, 11.18. The quarterly gains for the big three are noted below; the Russell advanced 2.39% in three months, while the VIX fell 3.12%. The PHLX Oil Service Sector index brought up the rear among U.S. equity indices, staggering to a 22.54% 3-month loss.  (19)

With the three marquee U.S. equity indices up between 15-27% in 12 months, investors are naturally skeptical about how long stocks can maintain such powerful momentum. Bulls still rule the Street, though – and bullish analysts see more upside to this market during the rest of 2017. It is true that past performance is no guarantee of future success, but the major Wall Street indices have tended to have a good second half in the past 20 years, regardless of their first-half performance. The Dow and Nasdaq have posted second-half advances during 14 of the past 20 years, and the S&P 500 has followed suit in 13 of the past 20 years. Looking closer at the years featuring these advances, the average second-half rise was 4.31% for the Nasdaq, 3.23% for the Dow, and 2.68% for the S&P. Since 1988, the S&P has never retreated during the second half of a year when it has gained 6% or more in a first half. So, in recent stock market history, when the bulls have been ruling the Street in the first half of a year, they have tended to keep running the rest of the year. Bears might say that the bulls who embrace these statistics are suffering from recency bias, and perhaps, that argument has merit. Then again, bearish analysts have predicted an end to this bull market year after year, and still, it persists.   (23)


Disclosure:

This material was prepared by MarketingPro, Inc., and does not necessarily represent the views of the presenting party, nor their affiliates. The information herein has been derived from sources believed to be accurate. Please note - investing involves risk, and past performance is no guarantee of future results. Investments will fluctuate and when redeemed may be worth more or less than when originally invested. This information should not be construed as investment, tax or legal advice and may not be relied on for the purpose of avoiding any Federal tax penalty. This is neither a solicitation nor recommendation to purchase or sell any investment or insurance product or service, and should not be relied upon as such. Indices do not incur management fees, costs and expenses, and cannot be invested into directly. All economic and performance data is historical and not indicative of future results. The Dow Jones Industrial Average is a price-weighted index of 30 actively traded blue-chip stocks. The NASDAQ Composite Index is a market-weighted index of all over-the-counter common stocks traded on the National Association of Securities Dealers Automated Quotation System. The Standard & Poor's 500 (S&P 500) is a market-cap weighted index composed of the common stocks of 500 leading companies in leading industries of the U.S. economy. NYSE Group, Inc. (NYSE:NYX) operates two securities exchanges: the New York Stock Exchange (the “NYSE”) and NYSE Arca (formerly known as the Archipelago Exchange, or ArcaEx®, and the Pacific Exchange). NYSE Group is a leading provider of securities listing, trading and market data products and services. The New York Mercantile Exchange, Inc. (NYMEX) is the world's largest physical commodity futures exchange and the preeminent trading forum for energy and precious metals, with trading conducted through two divisions – the NYMEX Division, home to the energy, platinum, and palladium markets, and the COMEX Division, on which all other metals trade. The DAX 30 is a Blue Chip stock market index consisting of the 30 major German companies trading on the Frankfurt Stock Exchange. The CAC-40 Index is a narrow-based, modified capitalization-weighted index of 40 companies listed on the Paris Bourse. The STOXX Europe 600 Index is derived from the STOXX Europe Total Market Index (TMI) and is a subset of the STOXX Global 1800 Index. The FTSE 100 Index is a share index of the 100 most highly capitalized companies listed on the London Stock Exchange. BSE Sensex or Bombay Stock Exchange Sensitivity Index is a value-weighted index composed of 30 stocks that started January 1, 1986. The Nikkei Asia300 Index is based on the "Asia300" group of must-watch companies selected by Nikkei. The composite index is supplemented by an index focusing specifically on companies in the ASEAN region, as well as individual indexes for 11 countries and regions. The MSCI World Index is a free-float weighted equity index that includes developed world markets, and does not include emerging markets. The MSCI Emerging Markets Index is a float-adjusted market capitalization index consisting of indices in more than 25 emerging economies. The Russell 2000 Index is a small-cap stock market index of the bottom 2,000 stocks in the Russell 3000 Index. The CBOE Volatility Index® is a key measure of market expectations of near-term volatility conveyed by S&P 500 stock index option prices. The PHLX Oil Service Sector Index (OSX) is a modified market weighted index composed of companies involved in the oil services sector. Additional risks are associated with international investing, such as currency fluctuations, political and economic instability and differences in accounting standards. This material represents an assessment of the market environment at a specific point in time and is not intended to be a forecast of future events, or a guarantee of future results. MarketingPro, Inc. is not affiliated with any person or firm that may be providing this information to you. The publisher is not engaged in rendering legal, accounting or other professional services. If assistance is needed, the reader is advised to engage the services of a competent professional.
 

Citations:

1 - seekingalpha.com/article/4085358-commodities-second-quarter-overview-outlook [7/3/17]
2 - investing.com/economic-calendar/ [6/30/17]
3 - tradingeconomics.com/united-states/consumer-confidence [7/4/17]
4 - nytimes.com/2017/06/02/business/economy/jobs-report.html [6/2/17]
5 - cnbc.com/2017/07/03/june-ism-manufacturing-index.html [7/3/17]
6 - instituteforsupplymanagement.org/ISMReport/NonMfgROB.cfm [6/5/17]
7 - forbes.com/sites/laurengensler/2017/06/14/fed-raises-rates-june/ [6/14/17]
8 - money.cnn.com/2017/06/28/news/economy/fed-stress-test-wall-street-results/index.html [6/28/17]
9 - investors.com/news/draghi-drama-undercuts-key-stock-market-support/ [6/29/17]
10 - nytimes.com/reuters/2017/07/03/business/03reuters-global-economy.html [7/3/17]
11 - cnbc.com/2017/06/29/china-manufacturing-accelerates-in-june-with-official-pmi-at-51-point-7-beating-expectations-for-51-point-0.html [6/29/17]
12 - ig.com/au/view-ig/2017/07/04/stock-markets-in-2017--a-good-first-half-38915 [7/4/17]
13 - foxbusiness.com/features/2017/06/30/europe-markets-european-stocks-close-in-red-germanys-dax-hobbled-by-bayer.html [6/30/17]
14 - asia.nikkei.com/Business/AC/Bets-on-Modi-s-reforms-help-India-stocks-beat-peers-in-first-half [6/30/17]
15 - msci.com/end-of-day-data-search [6/30/17]
16 - money.cnn.com/data/commodities/ [6/30/17]
17 - inman.com/2017/06/21/consumer-resilience-boosts-may-existing-home-sales/ [6/26/17]
18 - freddiemac.com/pmms/archive.html [7/4/17]
19 - barchart.com/stocks/indices#/viewName=performance [6/30/17]
20 - barchart.com/stocks/indices#/viewName=performance [3/31/17]
21 - bigcharts.marketwatch.com/historical/default.asp?symb=DJIA&closeDate=6%2F30%2F16&x=0&y=0 [6/30/17]
21 - bigcharts.marketwatch.com/historical/default.asp?symb=COMP&closeDate=6%2F30%2F16&x=0&y=0 [6/30/17]
21 - bigcharts.marketwatch.com/historical/default.asp?symb=SPX&closeDate=6%2F30%2F16&x=0&y=0 [6/30/17]
21 - bigcharts.marketwatch.com/historical/default.asp?symb=DJIA&closeDate=6%2F29%2F07&x=0&y=0 [6/30/17]
21 - bigcharts.marketwatch.com/historical/default.asp?symb=COMP&closeDate=6%2F29%2F07&x=0&y=0 [6/30/17]
21 - bigcharts.marketwatch.com/historical/default.asp?symb=SPX&closeDate=6%2F29%2F07&x=0&y=0 [6/30/17]
22 - treasury.gov/resource-center/data-chart-center/interest-rates/Pages/TextView.aspx?data=realyieldAll [7/3/17]
23 - cnbc.com/2017/06/30/chances-for-second-half-stock-market-gains-are-good.html [6/30/17]

Economic Update - March 2017

FED HIKES, LEAVES 2017 FORECAST UNCHANGED
As expected, the Federal Reserve raised the target range for the federal funds rate by a quarter-point last week to 0.75-1.00%. “The simple message is, the economy is doing well,” Fed chair Janet Yellen explained to the media following the move. The central bank’s dot-plot table still projects two more rate increases during the balance of 2017, with three rate hikes envisioned for both 2018 and 2019.  (1)

INFLATION PRESSURE EASES
February’s Consumer Price Index displayed only a 0.1% gain, compared to 0.6% in January. Core consumer prices moved 0.2% higher. The small February increase still left the headline CPI up 2.7% in the past 12 months. The Producer Price Index rose 0.3% for February, putting its yearly advance at 2.2%. (2)

SMALL GAINS IN SENTIMENT, RETAIL SALES
The initial March University of Michigan consumer sentiment index came in at 97.6 Friday, 1.3 points above its final February mark. Thanks mainly to “improved personal finances” among households, the index’s current economic conditions component hit a 17-year high. A Census Bureau report showed retail purchases up 0.1% in February, 0.2% with car and gasoline buying factored out. (2,3)

CALM WEEK SEES SMALL STOCK MARKET ADVANCE
Wall Street saw the March 15 Federal Reserve policy decision as an affirmation of the economy’s health; equities investors were not at all riled. Ending the week at 5,901.00, the Nasdaq Composite gained 0.67% in five days. The S&P 500 rose 0.24% in the same period to settle at 2,378.25 Friday, while the Dow Jones Industrial Average added just 0.06% across five trading sessions on the way to a Friday close of 20,914.62. Losing 3.26% in five days, the CBOE Volatility Index ended the week at 11.28.  (4)

THIS WEEK: Monday, nothing major is scheduled. Earnings announcements from FedEx, General Mills, Lands’ End, Nike, and Steelcase appear Tuesday. Wednesday, Wall Street reviews February existing home sales and earnings reports from Cintas, Five Below, Perry Ellis, and Winnebago. Thursday morning, Federal Reserve chair Janet Yellen delivers a keynote address at a Fed conference in Washington, D.C.; in addition, investors will eye the latest initial claims report, February’s new home sales report, and earnings news from Accenture, GameStop, KB Home, Micron Technology, Shoe Carnival, and Sportsman’s Warehouse. Friday offers a report on February hard goods orders and Q4 results from Finish Line.


Disclosure:

This material was prepared by MarketingPro, Inc., and does not necessarily represent the views of the presenting party, nor their affiliates. The information herein has been derived from sources believed to be accurate. Please note - investing involves risk, and past performance is no guarantee of future results. Investments will fluctuate and when redeemed may be worth more or less than when originally invested. This information should not be construed as investment, tax or legal advice and may not be relied on for the purpose of avoiding any Federal tax penalty. This is neither a solicitation nor recommendation to purchase or sell any investment or insurance product or service, and should not be relied upon as such. All market indices discussed are unmanaged and are not illustrative of any particular investment. Indices do not incur management fees, costs and expenses, and cannot be invested into directly. All economic and performance data is historical and not indicative of future results. The Dow Jones Industrial Average is a price-weighted index of 30 actively traded blue-chip stocks. The NASDAQ Composite Index is a market-weighted index of all over-the-counter common stocks traded on the National Association of Securities Dealers Automated Quotation System. The Standard & Poor's 500 (S&P 500) is a market-cap weighted index composed of the common stocks of 500 leading companies in leading industries of the U.S. economy. NYSE Group, Inc. (NYSE:NYX) operates two securities exchanges: the New York Stock Exchange (the “NYSE”) and NYSE Arca (formerly known as the Archipelago Exchange, or ArcaEx®, and the Pacific Exchange). NYSE Group is a leading provider of securities listing, trading and market data products and services. The New York Mercantile Exchange, Inc. (NYMEX) is the world's largest physical commodity futures exchange and the preeminent trading forum for energy and precious metals, with trading conducted through two divisions – the NYMEX Division, home to the energy, platinum, and palladium markets, and the COMEX Division, on which all other metals trade. Additional risks are associated with international investing, such as currency fluctuations, political and economic instability and differences in accounting standards. This material represents an assessment of the market environment at a specific point in time and is not intended to be a forecast of future events, or a guarantee of future results. MarketingPro, Inc. is not affiliated with any person or firm that may be providing this information to you. The publisher is not engaged in rendering legal, accounting or other professional services. If assistance is needed, the reader is advised to engage the services of a competent professional.


Citations.

1 - marketwatch.com/story/fed-raises-interest-rates-by-a-quarter-point-sees-two-move-moves-this-year-2017-03-15 [3/15/17]

2 - investing.com/economic-calendar/ [3/17/17]

3 - sca.isr.umich.edu/ [3/17/17]

4 - markets.wsj.com/us [3/17/17]

5 - bigcharts.marketwatch.com/historical/default.asp?symb=DJIA&closeDate=3%2F17%2F16&x=0&y=0 [3/17/17]

5 - bigcharts.marketwatch.com/historical/default.asp?symb=COMP&closeDate=3%2F17%2F16&x=0&y=0 [3/17/17]

5 - bigcharts.marketwatch.com/historical/default.asp?symb=SPX&closeDate=3%2F17%2F16&x=0&y=0 [3/17/17]

5 - bigcharts.marketwatch.com/historical/default.asp?symb=DJIA&closeDate=3%2F16%2F12&x=0&y=0 [3/17/17]

5 - bigcharts.marketwatch.com/historical/default.asp?symb=COMP&closeDate=3%2F16%2F12&x=0&y=0 [3/17/17]

5 - bigcharts.marketwatch.com/historical/default.asp?symb=SPX&closeDate=3%2F16%2F12&x=0&y=0 [3/17/17]

5 - bigcharts.marketwatch.com/historical/default.asp?symb=DJIA&closeDate=3%2F16%2F07&x=0&y=0 [3/17/17]

5 - bigcharts.marketwatch.com/historical/default.asp?symb=COMP&closeDate=3%2F16%2F07&x=0&y=0 [3/17/17]

5 - bigcharts.marketwatch.com/historical/default.asp?symb=SPX&closeDate=3%2F16%2F07&x=0&y=0 [3/17/17]

6 - treasury.gov/resource-center/data-chart-center/interest-rates/Pages/TextView.aspx?data=realyield [3/17/17]

7 - treasury.gov/resource-center/data-chart-center/interest-rates/Pages/TextView.aspx?data=realyieldAll [3/17/17]

Market Commentary - February 2016

From your Gilbert & Cook Investment Team

The downward slide of U.S. and global equity markets came swiftly in the first 12 trading sessions of 2016 (1).  The worst start to a year ever.  During a streak of tumultuous days like this, it is important to separate fear from facts. Sentiment from fundamentals. Emotion from discipline.

If supported by an extreme change in market fundamentals, the extent and trajectory of the January slide would say there is a high probability of a near term U.S. recession.  The Investment Team at Gilbert & Cook does not share this view.  The U.S. economy has created an average of 217,000 jobs per month for the past 4 years (2). Unemployment currently sits at 5%. (3)  The Housing Affordability Index is near a 40 year low (that’s a good thing) as measured by the average mortgage payment as a percentage of household income.  The consumer is strong.

Preliminary reading from the Bureau of Economic Analysis has the U.S. posting full year 2015 gross domestic product growth of 1.8%.  A slowing pace, but not a retreat.  The International Monetary Fund’s most recent global economic forecast for 2016 is +3.4% growth.  A far cry from any recessionary fears.  Slow and steady growth is healthy.  Capital is deployed prudently in such an environment.

Headlines out of China would have you worry that a slowdown in their economy will pull the U.S. into recession.  Again, not the case in our view.  All U.S. exports account for 9.3% of our GDP and China is less than 2% (4, 5).  If China exports went to zero our GDP in 2015 would have grown by 1.76% instead of 1.8%.  And our strong U.S. dollar makes imports from China relatively less expensive.

The Federal Reserve, albeit with fleeting conviction, started raising rates in December and paused in January.  We believe the Fed has telegraphed a gradual rate increase plan because they see a sustainable economic expansion in the U.S.  When Alan Greenspan raised rates 17 times from the summer of 2004 to the summer of 2006, Fed funds started at 1% and finished at 5.25% (6). The S&P 500 index was up +12% over that same timeframe (7). Chairman Janet Yellen of the current Fed would like to see a longer term target of 3 to 3.5%. Still fairly accommodative from a historical perspective.  And by many estimates, it will take several years to approach that target.

Low oil prices have been a double edged sword for some time.  On one hand, the energy sector (representing 10% of the S&P 500 index) has seen profits crater.  But on the other hand, the oil recession is a boon to consumers and businesses utilizing cheaper energy.  A very tough argument if you live in Houston, but earnings in the other 90% of the S&P 500 have continued to expand nicely.  Unlike the housing industry in 2008, energy businesses going through profit contraction help other areas of the economy.  Oil consumption has actually continued to expand, but a glut of supply is depressing oil prices.

Fear based selling is heightened by those investors with too much of their portfolios devoted to risk based assets.  A disciplined and well allocated portfolio matching investments with goals and time horizon allows for staying power during periods of “normal” price volatility.  As many of you have heard us explain in person, the S&P 500 index has had an average pullback of more than 14% each year for the past 36.  Nothing in the near term has been outside of those normal swings.  We view conditions as positive for equity investors over the long term, but there will be short term testing of those convictions.  Our goal as a firm is to help create confidence in the things we and our clients can control.  Please don’t hesitate to call any member of our team for answers specific to your situation.


1 - S&P Dow Jones Indices
http://www.spindices.com/indices/equity/sp-500

2 - Bureau of Labor Statistics
 http://data.bls.gov/timeseries/CES0000000001?output_view=net_1mth

3 - Federal Reserve Bank of St. Louis (FRED) https://research.stlouisfed.org/fred2/series/UNRATE?utm_expid=19978471-2.Y0NpAPxIQfK_8K7-O4DTQg.0&utm_referrer=https%3A%2F%2Fresearch.stlouisfed.org%2Ffred2%2Fsearch%3Fst%3Dunemployment

4 - International Monetary Fund
http://data.imf.org/?sk=FF15B084-3F75-48DA-8466-DBFE065561F8&ss=1415633111418

5 - Federal Reserve Bank of St. Louis (FRED)
https://research.stlouisfed.org/fred2/series/FYGDP

6 - Federal Reserve Bank of New York
https://www.newyorkfed.org/markets/statistics/dlyrates/fedrate.html

7 - S&P Dow Jones Indices
http://www.spindices.com/indices/equity/sp-500

Quarterly Economic Update - 3rd Quarter 2015

THE QUARTER IN BRIEF
The third quarter of 2015 is now history – and what a trying quarter it was. In looking back at Q3, we see not only a rough stretch for stocks and commodities but also a period in which the financial narrative for the year changed. At the start of July, investors focused on whether or not the Federal Reserve would raise interest rates in September. By the end of the quarter, the evident economic slowdown in China had become the year’s defining story. Key U.S. indicators waned as the quarter progressed, though the housing sector maintained its impressive sales pace. The stock market pulled back – the S&P 500 lost 6.94% in the quarter, which left it negative year-to-date.  (1)

DOMESTIC ECONOMIC HEALTH
As the quarter unfolded, the deceleration in overseas manufacturing began to affect America. For evidence, one needed only to look to hiring totals, hard goods orders, and the ISM purchasing manager index tracking the factory sector.

Even with its anecdotal basis, ISM’s manufacturing index is a hugely important indicator – and it was troubling to see it decline from a July reading of 52.7 to a September mark of 50.2, near the contraction level. (ISM’s non-manufacturing PMI went from 60.3 to 56.9 in the same span.) By August, headline durable goods orders were down 24.1% year-over year.   (2,3,4)

In September, the economy added a disappointing 142,000 new jobs – and the Labor Department revised July and August hiring downward to respective totals of 223,000 and 136,000. Annualized wage growth – which should be between 3-4% – remained low at 2.2%. The good news? In the ninth month of the year, headline unemployment was down to 5.1% while the U-6 “underemployment” rate dipped to 10.0%.   (5)

Inflation – at least as measured by the Consumer Price Index – remained a minor economic factor. By August, the CPI was up just 0.2% in the past 12 months, with the core CPI up just 1.8%. The headline CPI retreated 0.1% in August, its first pullback since January. As for the Producer Price Index, it was flat in August after a 0.2% rise in July; by August, annualized wholesale inflation was at -0.8%, negative for the seventh month in a row due to reduced energy costs.  (6,7)

Consumer confidence and personal spending held up reasonably well as economic warning signals came in from abroad. The Conference Board’s consumer confidence index reached a September mark of 103.0, rising from 101.5 in August. While the University of Michigan’s household sentiment index declined during each month of the third quarter, its final September reading of 87.2 represented a year-over-year advance of 2.6 points. Consumer spending was up 0.4% in both July and August; consumer incomes rose 0.5% in July and 0.3% in August. Retail purchases were up 0.7% in July and another 0.2% for August.  (8,9) 

As the quarter went on, the chances of the Federal Reserve raising interest rates seemed less likely. Indeed, the Fed made no move in September – but a dot-plot forecast it published projected the federal funds rate at 0.40% by the end of 2015. The poor September jobs report could alter that projection, as could the ongoing “global economic and financial developments” that the central bank referenced as cause to leave rates alone.  (10)

GLOBAL ECONOMIC HEALTH
Greece may have seized the headlines in Q2, but in Q3 the big story was China. Its stock market exhibited extreme volatility and its economic indicators unsettled investors here and abroad. By July, the warnings were evident: Chinese exports had shrunk 8.3% in a year, imports had fallen for nine consecutive months and the retail sales pace had reached a 15-year low.   (
11,12)

During Q3, the Shanghai Composite dropped more than 25%. China surprised investors by devaluing the yuan in August; it responded to the correction by putting severe controls on its stock market. China’s official manufacturing PMI showed sector contraction for a second straight month in September, ticking up to 49.8 from 49.7. The Markit/Caixin private-sector factory PMI for China hit a 5½-year low of 47.2 in September. Since as much as half the worldwide demand for coal, copper, and iron stems from China, this was troubling news indeed.   (13,14)

Economists questioned if China’s official GDP and manufacturing PMI readings were being vastly overstated. Oxford Economics estimates China’s 2015 GDP will be between 3-4%, and leading Swedish economist Mauro Gozzo projects 3% growth – far removed from the 7% expansion forecast by Chinese government officials.   (15)

The Markit (official) manufacturing PMI for the eurozone was a comparatively healthy 52.0 in September, down from 52.3 in August. Deflation had returned: the eurozone CPI retreated 0.1% year-over-year through September. The region’s unemployment rate remained at 11.0% last month.   (14,16)

COMMODITIES MARKETS
Last quarter, the Thomson Reuters/Jefferies CRB Index suffered a loss of 14.71%. The other notable commodity sector benchmark, the S&P GSCI index, retreated 19.3% (its poorest third quarter in 45 years).   (18,19)    

Looking at the S&P GSCI quarterly scorecard, only lean hogs posted a three-month advance, gaining 13.4%; the other 23 commodities all retreated. There were some major Q3 descents among ag and energy futures: crude oil lost 26.9%, unleaded gasoline 21.0%, heating oil 20.9%, and wheat 21.2%. Crude oil ended the quarter at $45.09 a barrel on the NYMEX.   (19,20) 

Precious and base metals also declined notably in Q3. Gold lost 4.8%, settling at a COMEX price of $1,115.20 an ounce on the quarter’s final day. Silver fell 6.8% in Q3, platinum 15.8%, palladium 3.2%, zinc 15.9%, copper 10.2%, and aluminum 7.9%.  (19,21)

Did the U.S. Dollar Index manage a third-quarter advance? Yes, it did. It settled at 96.35 on September 30, up 0.90% in three months.   (22)

REAL ESTATE
By August, new and existing homes were being bought up at a pace nicely exceeding year-ago levels. According to the National Association of Realtors, resales were up 6.2% annually in August, even after August turned out to be the second-weakest month for existing home sales in the past four-and-a-half years; 32% of buyers were first-timers. A Census Bureau report showed new home buying surging 21.6% in the 12 months ending in August.   (23)

NAR’s pending home sales index softened by 1.4% in August, but even with that retreat, it remained 6.1% higher than a year ago at a healthy 109.4. The overall S&P/Case-Shiller home price index for July showed a 5.0% advance across the past 12 months, ticking north from 4.9% in June.    (8,23)

Housing starts and building permits also showed significant annual gains according to the Census Bureau. Groundbreaking had increased 16.6% in the 12 months ending in August (14.9% for single-family projects). The number of permits issued in August surpassed the August 2014 number by 12.5% (8.7% for single-family construction).  (24)Did home loans become more expensive in Q3? For the most part, no. A quick check of the June 25 and September 24 Freddie Mac Primary Mortgage Market Surveys show average interest rates increasing only on the 1-year ARM, from 2.50% to 2.53%. The 30-year fixed grew cheaper, with the average interest rate sinking from 4.02% to 3.86%. The story was similar for the 15-year FRM and the 5/1-year ARM; average interst rates on the former declined from 3.21% to 3.08% while average interest rates on the latter dipped from 2.98% to 2.91%   (25)

LOOKING BACK ... LOOKING FORWARD
Were there any bright spots on Wall Street during a dismal quarter? Yes. Beneath the big three, a few indices did post some nice three-month advances. The Dow Jones Internet index gained 7.07% in Q3, and the Dow Jones Utilities Average rose 4.82%. The Nasdaq Insurance index ticked up 0.73% for Q3. This paled in comparison to the 34.39% Q3 rise of the CBOE VIX. Third quarter performances for the marquee indices left much to be desired. Their quarter-end settlements were as follows: DJIA, 16,284.70; S&P 500, 1,920.03; NASDAQ, 4,620.16. The small caps were not spared – the Russell 2000 lost 12.22% for the quarter, settling at 1,100.69 on September 30.   (1)

Entering the fourth quarter, stock market investors have a central question: can the year be salvaged? Can the S&P 500 possibly finish 2015 with an annualized gain? A Q4 rate hike by the Federal Reserve now looks much less likely, but even if the Fed avoids making a move, will that ease any anxiety about China’s economy or the health of its stock market? Oil prices could remain low, with a major supply glut persisting at a time of reduced demand. Few investors are excited about this oncoming earnings season. Still, the fall could surprise to the upside. As recently as 2013, the S&P 500 gained 10% in Q4. In 2011, it advanced 11% in the last three months of the year. The bulls may be milling around right now, but there is a chance they could run again before 2015 is over – though it will take some notable earnings surprises and encouraging headlines to truly set them loose.   (28)


Citations.

1 - online.wsj.com/mdc/public/page/2_3022-quarterly_gblstkidx.html [9/30/15]
2 - instituteforsupplymanagement.org/ISMReport/MfgROB.cfm [10/1/15]
3 - instituteforsupplymanagement.org/ISMReport/NonMfgROB.cfm [10/5/15]
4 - ycharts.com/indicators/durable_goods_orders [10/5/15]
5 - forbes.com/sites/samanthasharf/2015/10/02/jobs-report-u-s-added-142000-jobs-in-september-unemployment-rate-steady-at-5-1/ [10/2/15]
6 - marketwatch.com/story/inflation-falls-for-first-time-since-january-cpi-data-show-2015-09-16 [9/16/15]
7 - bls.gov/news.release/ppi.nr0.htm [9/11/15]
8 - marketwatch.com/economy-politics/calendars/economic [10/2/15]
9 - cnbc.com/2015/09/25/us-consumer-sentiment-final-reading-in-sept-rises-to-872-vs-867-estimate.html [9/25/15]
10 - marketwatch.com/story/federal-reserve-keeps-interest-rates-unchanged-but-forecasts-hike-this-year-2015-09-17 [9/17/15]
11 - foxbusiness.com/markets/2015/08/12/us-stock-futures-slump-as-china-devalues-yuan-again/ [8/12/15]
12 - marketwatch.com/story/chinas-economy-enters-second-half-of-2015-on-weak-note-2015-08-09 [8/9/15]
13 - news.morningstar.com/articlenet/article.aspx?id=716336 [9/29/15]
14 - channelnewsasia.com/news/business/international/global-economy-loses-stea/2163526.html [10/1/15]
15 - forbes.com/sites/jnylander/2015/09/23/swedens-top-economist-puts-chinas-gdp-growth-at-3-others-are-less-optimistic/ [9/23/15]
16 - bbc.com/news/business-34401035 [9/30/15]
17 - msci.com/end-of-day-data-search [9/30/15]
18 - investing.com/indices/thomson-reuters---jefferies-crb-historical-data [10/5/15]
19 ­- indexologyblog.com/2015/09/30/commodities-post-3rd-worst-q3-since-1970/ [9/30/15]
20 - 247wallst.com/investing/2015/09/30/the-4-stocks-that-dominated-the-dow-on-wednesday-2/ [9/30/15]
21 - coinnews.net/2015/09/30/gold-silver-fall-on-month-and-quarter-us-coin-sales-robust/ [9/30/15]
22 - online.wsj.com/mdc/public/npage/2_3050.html?mod=mdc_curr_dtabnk&symb=DXY [10/5/15]
23 - auction.com/blog/september-housing-round-up-housing-market-hits-a-snag-summer-ends-with-a-whimper/ [10/5/15]
24 - mortgagenewsdaily.com/09172015_permits_and_starts.asp [9/17/15]
25 - freddiemac.com/pmms/archive.html [10/5/15]
26 - bigcharts.marketwatch.com/historical/default.asp?
27 - treasury.gov/resource-center/data-chart-center/interest-rates/Pages/TextView.aspx?data=realyieldAll [10/4/15]
28 - money.cnn.com/2015/09/29/investing/stocks-third-quarter-fourth-quarter-rally/ [9/29/15]